

See how AI recommends your business
Perform a free audit
Methodological Note: The report was prepared based on data from monitoring 100 online stores belonging to 10 e-commerce categories. The data has been aggregated and anonymized, so the report does not identify individual brands. For each store, a set of 100 queries reflecting different stages of the purchasing process was monitored daily. The results presented in the report are aggregates for the entire sample and analyzed segments and should not be interpreted as a forecast of results for each online store.
Key Conclusion
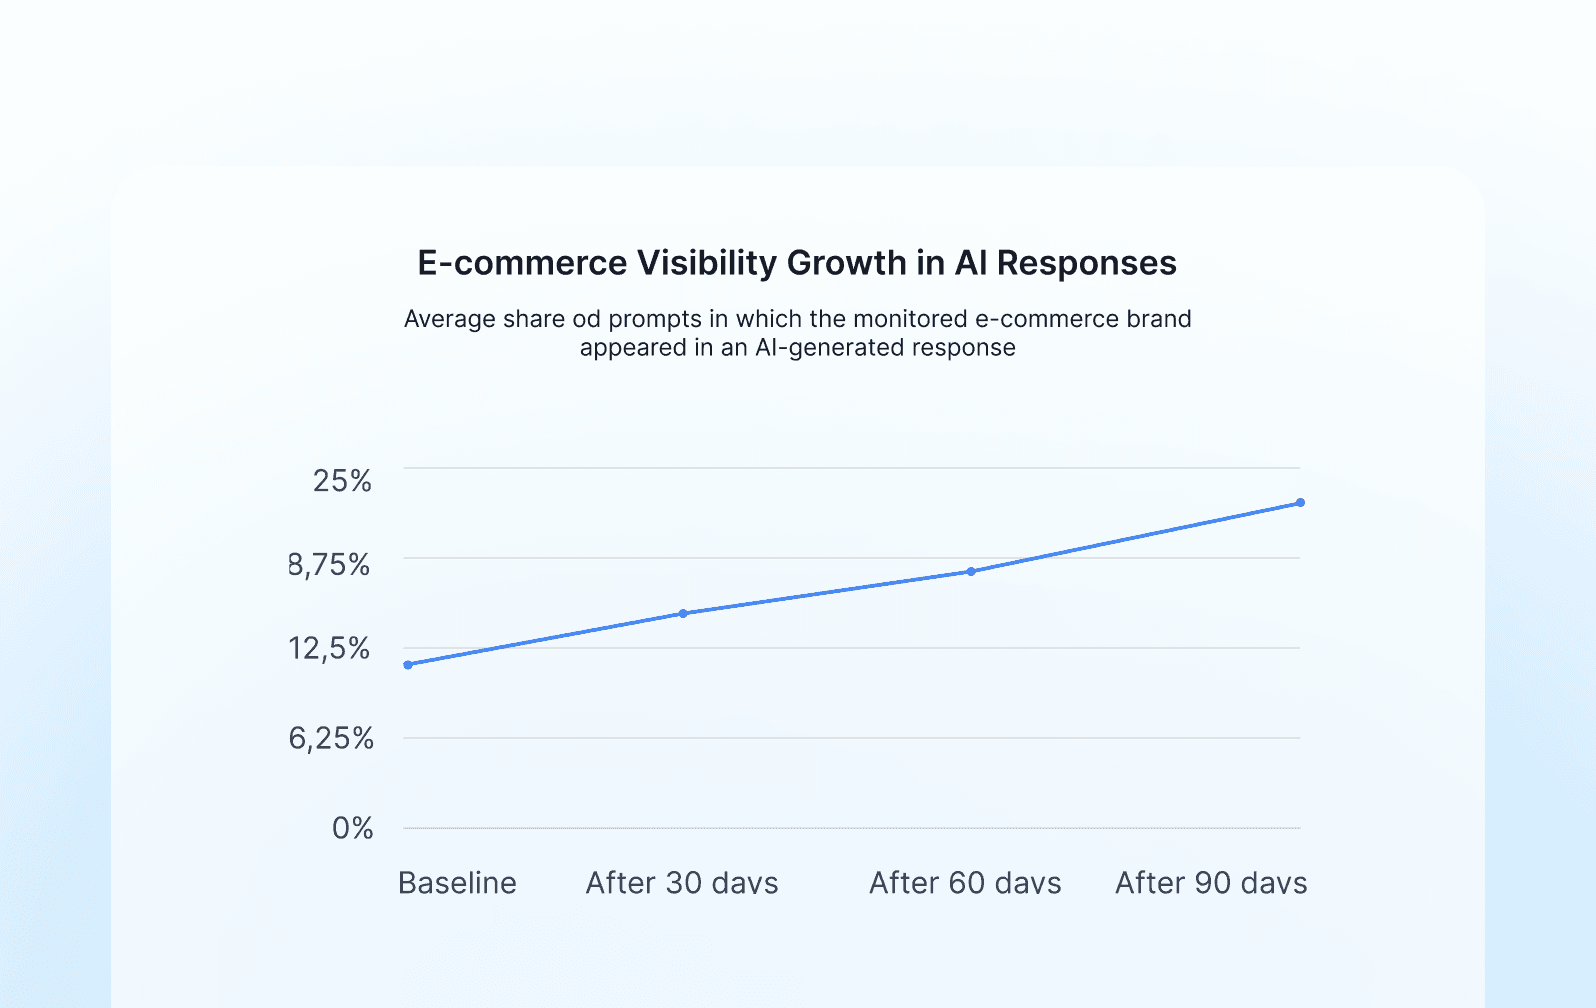
In the analyzed dataset, the average visibility of online stores in AI responses increased over 90 days from 11.8% to 22.6%. This represents an increase of 10.8 percentage points, or 91.5% compared to the initial level.
However, the change was not uniform. Out of 100 analyzed profiles, 43 at least doubled their visibility, 35 increased it by 25–99%, and 7 ended the observation period with a lower result than at the beginning.
The largest increases were observed in the group of stores conducting regular activities related to updating product information, developing content that meets specific customer needs, and implementing recommendations resulting from monitoring.
The result shows a correlation between the consistency of actions and the increase in visibility in the analyzed sample. However, it does not mean that the same level of growth can be guaranteed to every brand or that the observed correlation results solely from the actions taken.
Report in numbers
| Indicator | Start | After 30 days | After 60 days | After 90 days | Change after 90 days |
|---|---|---|---|---|---|
| Average visibility | 11.8% | 14.7% | 18.2% | 22.6% | +91.5% |
| Presence in the TOP 3 recommendations | 4.9% | 6.3% | 8.5% | 11.7% | +138.8% |
| Citation Rate | 2.7% | 3.4% | 4.6% | 6.8% | +151.9% |
| Share of Voice | 8.6% | 10.3% | 12.5% | 15.4% | +79.1% |
| Average brand position* | 5.8 | 5.3 | 4.7 | 4.2 | improvement of 1.6 positions |
* Average position calculated only for responses where the brand was mentioned. A lower score is better.
Scope of the study and initial conclusions
- 100 online store profiles
- 10,000 unique shopping and product prompts
- 10 analyzed e-commerce sectors
- 5 AI response environments
- 43% of stores at least doubled their visibility within 90 days
- 78% of stores increased visibility by at least 25%
How was the research model designed?
The study covered 100 online stores, 10 from each analyzed sector. For each store, 100 prompts reflecting real stages of the purchasing decision were prepared. A total of 10,000 unique queries were created.
The prompts were divided into five groups:
| Type of prompt | Share in the set | Intention |
|---|---|---|
| Discovery and recommendations | 30% | “Which trekking shoes to choose for easy trails?” |
| Problem and solution | 25% | “What will help reduce dog shedding at home?” |
| Comparisons | 20% | “Is an automatic or manual espresso machine better?” |
| Product and transactional | 15% | “Where to buy an office chair for 100 EUR?” |
| Brand validation | 10% | “Is brand X trustworthy?” |
Visibility was checked in five environments: ChatGPT, Gemini, Google AI, Claude, and Grok. The same set of prompts was analyzed daily for 90 days.4.5 million AI responses were analyzed.
What does visibility mean in this report?
The basic metric shows the percentage of prompts in which the monitored brand appeared in the AI response. For example, a visibility of 20% means that the brand was mentioned in 20 out of 100 checked queries.
However, the mention alone does not exhaust the analysis. Therefore, the following were also included:
- TOP 3 Rate, which is the share of responses in which the brand was among the top three recommendations
- Citation Rate, the percentage of all analyzed responses in which the monitored brand's site was indicated as a source of information or a link to it appeared
- Share of Voice, which is the brand's share in all mentions regarding it and monitored competitors
- Average Position, which is the average place of the brand on the recommendation list if it was mentioned
Visibility after three months: an increase of 91.5%
At the beginning of the study, brands appeared in an average of 11.8% of responses. After the first month, the result increased to 14.7%. A more pronounced acceleration occurred between the 30th and 90th days: after two months, visibility was 18.2%, and after three, it was 22.6%.
| Measurement Moment | Visibility | Index, start = 100 | Growth relative to start |
|---|---|---|---|
| Start | 11.8% | 100 | 0% |
| 30 days | 14.7% | 125 | +24.6% |
| 60 days | 18.2% | 154 | +54.2% |
| 90 days | 22.6% | 192 | +91.5% |
Data shows that assessing effects after a few or several days may be premature. The content must be published, discovered by information-gathering systems, processed, and utilized in responses. In practice, the first signals may appear earlier, but a fuller picture of the change is only provided after several subsequent measurement cycles.
Not all stores grew at the same pace
The distribution of changes was clearly varied:
- 43 stores at least doubled their visibility
- 35 stores increased it by 25-99%
- 15 stores recorded an increase of less than 25% or a result close to the initial one
- 7 stores ended the period with a result lower than at the start
At the start, 31 out of 100 stores did not appear in any of the key prompts in their category. After 90 days, the number of such stores dropped to 9 in the study. At the same time, the median visibility increased from 10.6% to 20.1%.
The conclusion is simple: the average increase was not the result of a few exceptionally strong brands. The improvement encompassed most of the sample, although its scale depended on the industry and the intensity of actions.
Which industries gained the most?
The highest dynamics were achieved in industries where customer questions are detailed, problem-oriented, and require clarification. This includes, among others, supplements, pet products, automotive parts, and home equipment.
| Industry | Start | After 90 days | Relative change | Change in p.p. |
|---|---|---|---|---|
| Health and supplements | 8.4% | 20.3% | +141.7% | +11.9 |
| Automotive parts and accessories | 7.6% | 17.2% | +126.3% | +9.6 |
| Pet Supplies | 9.8% | 21.8% | +122.4% | +12.0 |
| Home and Garden | 12.1% | 25.4% | +109.9% | +13.3 |
| Sport and outdoor | 11.7% | 23.8% | +103.4% | +12.1 |
| Children and toys | 13.9% | 25.6% | +84.2% | +11.7 |
| Fashion and footwear | 13.5% | 23.9% | +77.0% | +10.4 |
| Consumer electronics | 10.9% | 18.6% | +70.6% | +7.7 |
| Specialized food | 14.3% | 23.6% | +65.0% | +9.3 |
| Beauty and cosmetics | 15.8% | 25.8% | +63.3% | +10.0 |
The largest relative increase does not always mean the highest final visibility. The health and supplement industry started from a low level, so the growth from 8.4% to 20.3% resulted in a dynamic exceeding 140%. In contrast, cosmetics had the highest initial visibility and achieved the highest final result after three months, despite lower percentage dynamics.
Why do some categories grow faster?
The study showed that categories meeting three conditions gained an advantage:
- Customers ask many detailed questions before purchasing
- Product choice depends on parameters, application, or user problem
- The store can publish specific knowledge that cannot fit in a short product description
This may partially explain the high dynamics observed in the home and garden category. Users rarely ask only about a specific product name. More often, they describe the space, budget, constraints, and expected outcome. A store that explains such situations better than the competition provides models with the material needed to build useful recommendations.
Results varied between AI systems
The same brand may be well visible in one system and almost invisible in another. Each environment uses a different set of sources, information retrieval methods, and response construction mechanisms.
| AI Environment | Visibility at Launch | Visibility after 90 Days | Relative Change |
|---|---|---|---|
| ChatGPT | 13.7% | 25.4% | +85.4% |
| Gemini | 11.9% | 23.7% | +99.2% |
| Google AI | 9.4% | 18.2% | +93.6% |
| Claude | 10.1% | 20.1% | +99.0% |
| Grok | 13.9% | 25.6% | +84.2% |
| Average | 11.8% | 22.6% | +91.5% |
Even greater differences are visible in citations:
| AI Environment | Starting Citation Rate | Citation Rate after 90 days |
|---|---|---|
| ChatGPT | 3.1% | 7.6% |
| Gemini | 3.4% | 8.2% |
| Google AI | 5.8% | 10.9% |
| Claude | 0.9% | 2.9% |
| Grok | 0.3% | 4.4% |
| Average | 2.7% | 6.8% |
The result shows why a single test in one chat is insufficient to assess visibility. A brand may be frequently mentioned but rarely quoted. It may also appear high in comparative questions and disappear in problem-related queries. Only continuous monitoring of multiple models and prompt groups reveals the actual visibility structure.
The greatest increase in visibility was recorded for problem prompts
Not every group of questions reacted to actions to the same extent. The greatest dynamics were achieved by queries where the user described the problem, expected outcome, or conditions of product use.
| Prompt intention | Start | After 90 days | Relative change |
|---|---|---|---|
| Problem and solution | 9.8% | 23.4% | +138.8% |
| Discovery and recommendations | 8.4% | 19.2% | +128.6% |
| Comparisons | 12.9% | 24.6% | +90.7% |
| Product and transactional | 11.6% | 20.5% | +76.7% |
| Brand validation | 22.8% | 28.1% | +23.2% |
Prompts containing the brand name had high visibility right from the start. Their growth potential was therefore limited. A much greater scope for improvement was provided by questions asked before the customer knows a specific brand, for example:
- “What mattress to choose for back pain and side sleeping?”
- “How to choose food for a dog with a sensitive digestive system?”
- “Which running shoes are suitable for a person with a wide foot?”
- “Which robotic lawn mower can handle a sloped yard?”
At this stage, the AI's response can introduce a new brand into the purchasing process. For e-commerce, this is the most valuable area, as it allows reaching users who have not yet decided where to buy the product.
Intensity of actions and change in visibility over 90 days
The studied stores were divided into three groups based on the intensity of actions taken during the observation period.
The Semly AI Growth Score was used for evaluation - a metric that ranks profiles according to the regularity of actions related to improving visibility in AI responses.
The analysis showed a clear relationship between the level of activity and the change in visibility. The group conducting the most regular actions achieved the greatest improvement over 90 days.
This is an observational relationship. Based on the comparison of groups alone, it cannot be concluded that the intensity of actions was the only cause of differences in results.
| Group | Characteristics | Start | After 90 days | Change |
|---|---|---|---|---|
| High activity | regular publications, data updates, and implementation of most recommendations | 12.0% | 31.2% | +160% |
| Average activity | 2-3 actions per month, partial implementation of recommendations | 11.8% | 22.0% | +86% |
| Low activity | single actions or lack of regularity | 11.6% | 14.8% | +28% |
The difference between the groups was small at first, but after three months it became very clear. The most active stores achieved over twice the final visibility compared to the low-activity group.
This does not mean that the number of publications automatically leads to an increase. What matters is the alignment of content with actual gaps in AI responses. Four articles addressing questions where the brand loses to competitors may have more value than several general texts prepared without prompt analysis.
What connected the fastest-growing profiles?
In the studied group of leaders, five elements were most common:
- Precise product data. Parameters, applications, limitations, compatibility, and availability information were recorded in content readable without executing JavaScript.
- Content addressing specific questions. Articles addressed real shopping problems, not just broad category phrases.
- Comparisons based on criteria. Stores explained for whom a given solution would be suitable and when it is better to choose another option.
- Consistency of information. Product descriptions, categories, guides, structured data, and brand information did not contradict each other.
- Regular measurement. Changes were assessed on the same prompts and in the same models, allowing for the distinction between a lasting trend and a one-time fluctuation.
Mentioning is not the same as citing
After 90 days, the Mention Rate was 22.6%, while the Citation Rate was 6.8%. This means that the brand was mentioned much more often than its site was cited as a source.
Assuming that citing is a subset of responses containing a mention of the brand, about 30% of responses with a mention also included a citation of the brand's site.
This does not undermine the value of presence. A recommendation without a link can build recognition and influence later brand searches. However, from the perspective of site traffic, citation is particularly important as it provides users with a direct path to the store.
In the study on the increase of the Citation Rate, the following were most frequently associated:
- clear answers to specific questions
- clear titles and headings describing the user's problem
- unique data, comparisons, and instructions
- visible information about the author, updates, and sources
- logical linking between the guide, category, and product
- structured data aligned with the page content
The conclusion for stores is practical: it is worth measuring separately whether the brand is mentioned, whether it ranks high on the recommendation list, and whether its site is cited as a source. Each of these results describes a different stage of building visibility.
TOP 3 grew faster than the overall number of mentions
The share of responses in which the brand ranked in the top three recommendations increased from 4.9% to 11.7%. This is an improvement of 138.8%, clearly greater than the increase in visibility itself.
At the same time, the average position of the brand improved from 5.8 to 4.2. In practice, the studied stores not only appeared more often but also moved closer to the beginning of the responses, where the recommendation is more visible and easier to remember.
This result shows why the response 'the brand appeared' is insufficient. Listing the store in seventh place has a different value than presenting it as the first recommendation with justification and a link.
5 conclusions for e-commerce owners
1. Visibility in AI can be changed, but it takes time
The observed increase from 11.8% to 22.6% did not occur after one publication. The largest part of the improvement appeared after the first month when systematic actions began to create a broader and more coherent picture of the offer.
2. The biggest opportunity lies before asking about the brand
Problematic and recommendation prompts grew more than twofold. These are questions from users who know what they need but haven't chosen a product or seller yet.
3. Every industry needs its own set of prompts
A cosmetics store, an auto parts seller, and a home goods brand participate in completely different decision-making processes. A common, general set of questions will not reveal their true visibility.
4. You need to measure several dimensions simultaneously
Mention Rate, Citation Rate, TOP 3, Share of Voice, and average position answer different questions. Only together do they show whether a brand is recognized, recommended, and pointed out as a source.
5. Advantage is built by a system, not a single article
The best results were achieved by stores that combined monitoring, competitive analysis, optimization of product information, and regular publication of content addressing identified gaps.
90-Day Visibility Growth Plan for Your Brand
Days 1-30: Diagnosis and Foundations
- Build a set of prompts including recommendations, issues, comparisons, and product questions
- Check brand visibility and key competitors in several AI models
- Select 10-20 high business value queries where competitors are visible, but your brand is not present
- Verify that bots and information-gathering systems have access to the site
- Supplement key product and category descriptions with applications, parameters, limitations, and answers to customer questions
Days 31-60: publishing and distributing knowledge
- Publish content prepared based on specific visibility gaps
- Link guides with appropriate categories and products
- Add comparisons, tables, short answers, and clearly defined selection criteria
- Ensure consistency in product data, availability, pricing, and brand information
- Compare the second measurement with the baseline, separately for each group of prompts
Days 61-90: scaling what works
- Expand on topics that improved visibility or Citation Rate
- Update content that has been discovered but still does not lead to citations
- Analyze new competitor mentions and changes in the TOP 3
- Limit content creation that does not address any monitored user issue
- Evaluate the effects based on trends from several measurements, not a single model response
Study Limitations
The report's results should be interpreted in the context of several limitations.
Responses generated by AI systems may vary between successive calls of the same prompt. They are influenced by factors such as model updates, changes in information retrieval mechanisms, source availability, and the way responses are constructed by different platforms.
The study primarily shows the direction and scale of changes observed in the analyzed dataset, rather than a guaranteed outcome for each brand.
The division of stores by activity intensity is observational. Higher activity was associated with greater visibility growth, but the analysis does not allow us to conclude that it was the sole cause of this growth.
Other factors may also have influenced the results, such as prior brand recognition, domain authority, brand presence in external sources, changes in offerings, and updates to the AI systems themselves.
For this reason, the results should be treated as an analysis of dependencies observed over a 90-day period, rather than a guarantee of specific growth after specific actions are taken.
Summary
An analysis of 100 store profiles and 10,000 prompts shows that the visibility of e-commerce brands in AI responses can significantly change over a few months.
In the analyzed dataset, the average visibility increased from 11.8% to 22.6% over 90 days. The greatest dynamics were recorded for problem and recommendation queries — that is, at the stage where the user knows their need but has not yet chosen a specific brand or product.
At the same time, the results indicate a clear relationship between the regularity of actions and the scale of observed growth. Stores in the high activity group ended the study period with significantly higher visibility than profiles that conducted actions sporadically.
This does not mean that a single optimization automatically leads to a specific increase. Visibility in AI depends on many factors, including the quality and availability of brand information, sources used by AI systems, competition, and changes occurring in the models themselves.
Therefore, a practical approach to AI Search should combine regular measurement, identifying gaps in AI responses, improving the quality of product and brand information, and publishing content that addresses specific user needs.
Share:
